Linear and Logistic Regression, Part 1: Understanding the Models
Note: This post is part 1 of a 3-part series: part 1, part 2, part 3.
Regression is when you measure specific data points and fit a function to the trend. This can be used to establish connections between known variables and uncertainties, like the probability of a heart attack occurring via known traits. Another example could be determining the perfect amount of something, like the perfect amount of toppings on a pizza. You can relate the amount of toppings with customer satisfaction and determine an average amount of toppings that would lead to best reviews from customers.
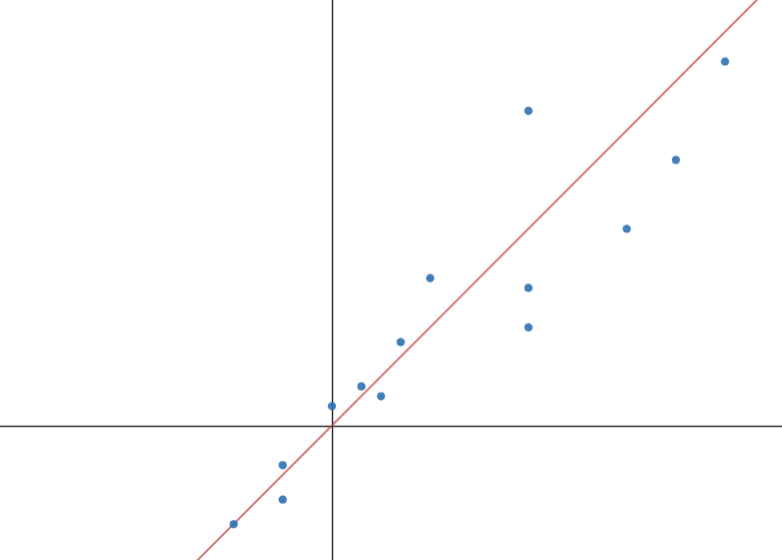
There are two main types of regression I’m going to talk about, linear and logistic. Linear regression comes in the form of a straight line:

Linear regression can be modeled with this equation:
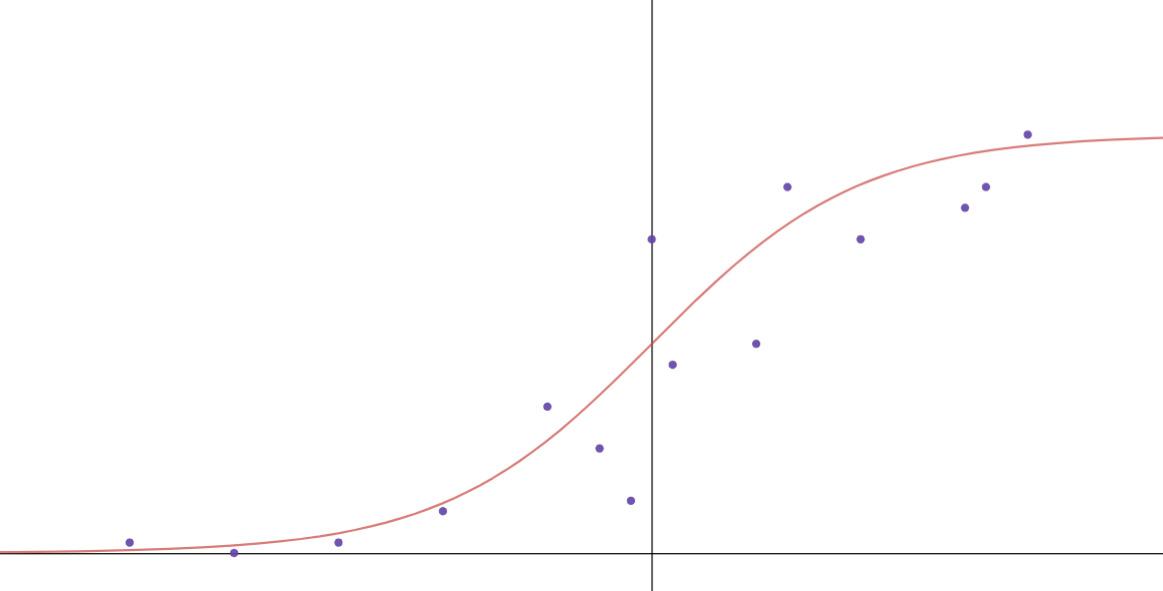
Logistic regression is a form of regression that comes in a sigmoid shape and has an upper and lower limit. This sigmoid shape starts at the lower limit, but once it increases and goes towards the higher limit, it levels out again, forming the graph’s s-like shape.

Logistic regression can be modeled with this equation:
This is the standard one-variable equation but both can be changed to fit multiple variables. Linear becomes
and logistic becomes
These regressions can be used to fit different scenarios. The crucial difference between the regressions is their limits.
For example, say we want to model the population of a species in a new environment. This would be a clear cut case of using logistic over linear because you can’t have the people of a species grow forever due to environmental constraints. This is where we should choose logistic regression over linear regression.
Linear regression, on the other hand, doesn’t have bounds and is used to model different scenarios. Say you’re modeling experience with a game versus how many points you can score. The more you practice, the better you get, and the more points you can score. You could also use linear regression to model the yield of crops depending on how much water or fertilizer you use.\newline
More on Logistic Regression
Logistic regression is also perfect for determining probabilities. The reason you can use it to predict probabilities is due to its limits. Probability must be between $0\%$ and $100\%.$ A specific example of this is the weather. You can determine the chance of rain or sunshine using past weather patterns. Linear regression can’t model probabilities because there are no limits. There isn’t a $200\%$ of something happening.\newline
Logistic regression also doesn’t have to be in the bounds of 0 to 1, though that is normal. Remember this equation:
If you change the numerator, then that is how you can change the upper limit of your regression.
In the above equation, $U$ is the upper limit. This can be used for, say, a movie rating system that goes from 0 to 10 or 0 to 5 stars.
Not only can you change the upper bound, but you can also change the lower bound. Here is a generalized formula to fit a logistic regression for bounds of your choice:
In this equation, $U$ is your upper limit, and $L$ is your lower limit. We would want to change the limits for different scenarios, just like usual.
For example, say you have a crowd of people and you want to predict the direction in which the crowd will move. This could go from $-180^\circ$ to $180\circ$ where $0^\circ$ represents straight ahead, $-90^\circ$ represents left, and $90^\circ$ represents right. There are many different scenarios in which you wouldn’t want the standard $0$ to $1$ bounds.
This post is part 1 of a 3-part series. Click here to continue to part 2.
